ClinicianPulse®
A product site for clinicians, health systems, payors, and AI partners.
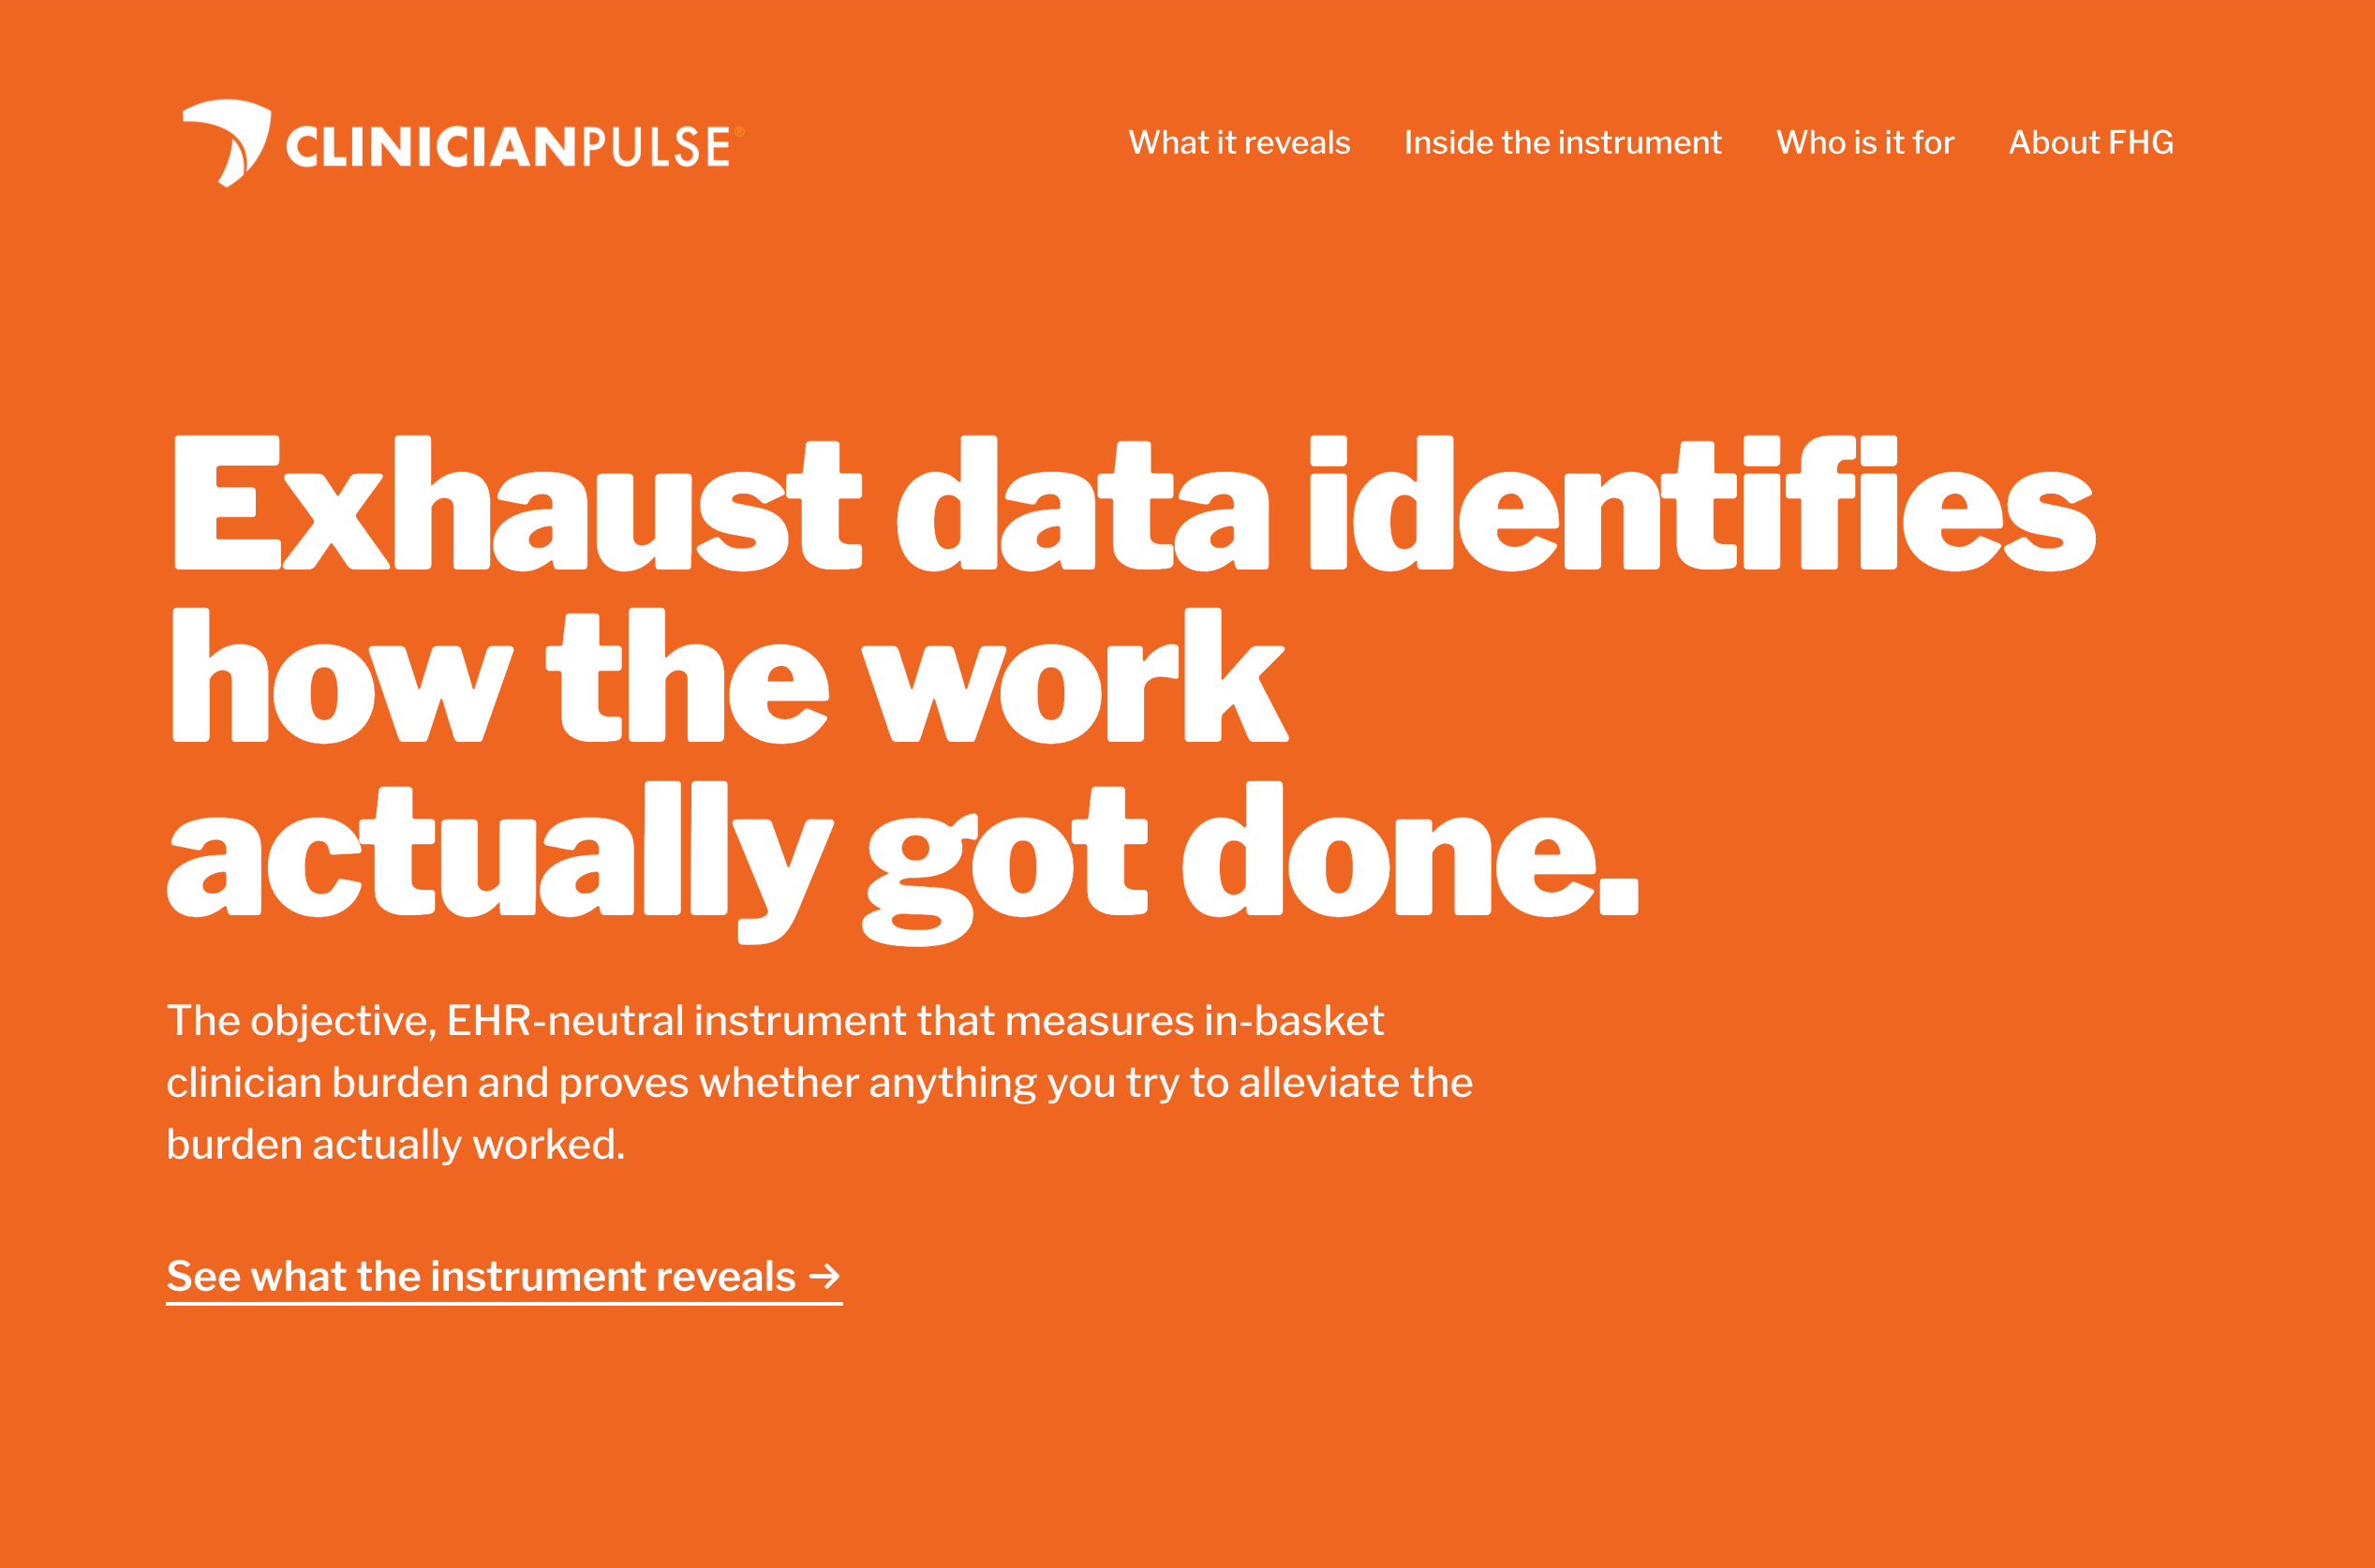
Forward Health Group is a healthcare data analytics company. ClinicianPulse, one of its products, measures where a clinician’s day actually goes, using the record every EHR already keeps. It had four audiences with very different questions: clinicians, health systems, payors, and AI and technology partners. All of them needed to understand what the product does and how it saves time and money, and in the end increases patient access and lowers the cost of care.
My role: Strategy, UX, information architecture, visual design, and direction of an AI-assisted build. Copy by FHG’s content lead.
Challenge
The product’s value wasn’t immediately clear. Buyers left demos without the tools to make the case to budget holders, while the product needed to speak to four distinct healthcare audiences.
Solution
Clear, strategic language showing how the product benefits each role in healthcare, plus a closer look at the instrument, all written to answer the questions the client services team hears most.
audiences, each with its own path through one site
pages that walk a champion through the product, step by step
designer, directing an AI build through numbered, reviewed specifications
Listening first
Before designing anything, I met with FHG’s client services team, the people who talk to customers every day. Those conversations showed what buyers were missing and which questions came up most.
Most visitors would arrive as champions who had already seen a demo, not as organic traffic, so the site had to help them explain the product to others. It still had to work for someone arriving cold. The global navigation is named for the questions buyers ask: What it reveals, Inside the instrument, and Who is it for.

One site, multiple audiences
The people who hold the budget needed to understand the savings. Clinicians needed to see what it meant for their time and their patients. Each section speaks to one purpose and one audience, and the Who is it for page lets every visitor start with the question they’re already asking.


Showing, not telling
Instead of dashboard screenshots, the site uses drawn diagrams, each labeled “a diagram, not data,” with numbered callouts that teach a visitor how to read it. An interactive calculator lets buyers put in their own numbers and see what recovered time could mean for their team.


This site is still in progress. Figures shown are illustrative and de-identified, as noted on the site itself.